Your AI agent is working… until it’s done.
Three weeks ago, I was talking to the founder of a fast-growing SaaS startup who felt he had finally cracked AI-powered customer support.
Their autonomous agent was answering tickets around the clock, customers weren’t complaining, and every dashboard looked healthy. Success, right?
Not even close.
Then came the monthly invoice.
In just four days, the agent quietly spent over $14,000 in API costs. Nothing technically “failed.” The application remained online. Successful responses to requests were received. Customers were finally getting answers. Traditional monitoring platforms happily reported green checkmarks across the board.
The real problem was buried beneath those green checkmarks.
Instead of efficiently resolving each support request, the agent kept repeating the same logic cycle. He would summarize the ticket, decide if he needed more context, retrieve the information he already had, summarize everything again, and repeat the process before finally responding. A customer request triggered dozens of unnecessary model calls. Everything looked normal from the outside while spending quietly spiraled out of control.
Many teams experience this same inconvenient reality after moving AI agents into production.
Building agents is typically not that hard anymore. Frameworks have matured, APIs are easy to use, and powerful models are available with just a few lines of code. What’s still surprisingly difficult is understanding what your agents are actually doing after deployment.
Most engineering teams already have observability tools. They rely on platforms that measure uptime, response time, error rate, CPU utilization, and infrastructure health. Those tools are great for telling you whether an application is live or not.
When an application starts making its own decisions, it becomes much less useful.
An AI agent doesn’t just execute the code you write. It’s about planning, choosing tools, interpreting results, correcting previous decisions, and occasionally taking detours that no one expected.
Two nearly identical user requests can produce completely different execution paths. That’s what makes these systems powerful – and exactly what makes them difficult to monitor with traditional software tooling.
A standard application performance monitor might tell you:
- The request completed successfully.
- HTTP status returned 200.
- Response time: 2.4 seconds.
Technically correct.
Practically useless.
It won’t tell you that the agent took nine rational steps in reaching an answer that should have taken three. It will not show that a tool failed twice before succeeding on the third try.
It won’t reveal that token usage suddenly doubled after a prompt update last Friday. And it certainly won’t explain why a particular workflow now costs four times more than it did last month.
This is the visibility gap that modern LLM observability platforms are trying to solve.
Despite the name, this isn’t just about collecting logs or creating beautiful dashboards. Most teams already have plenty of logs. In many cases, they have too many. The challenge is not to collect more information – it is to collect the right information with enough context to answer questions that no one knew they would have to ask.
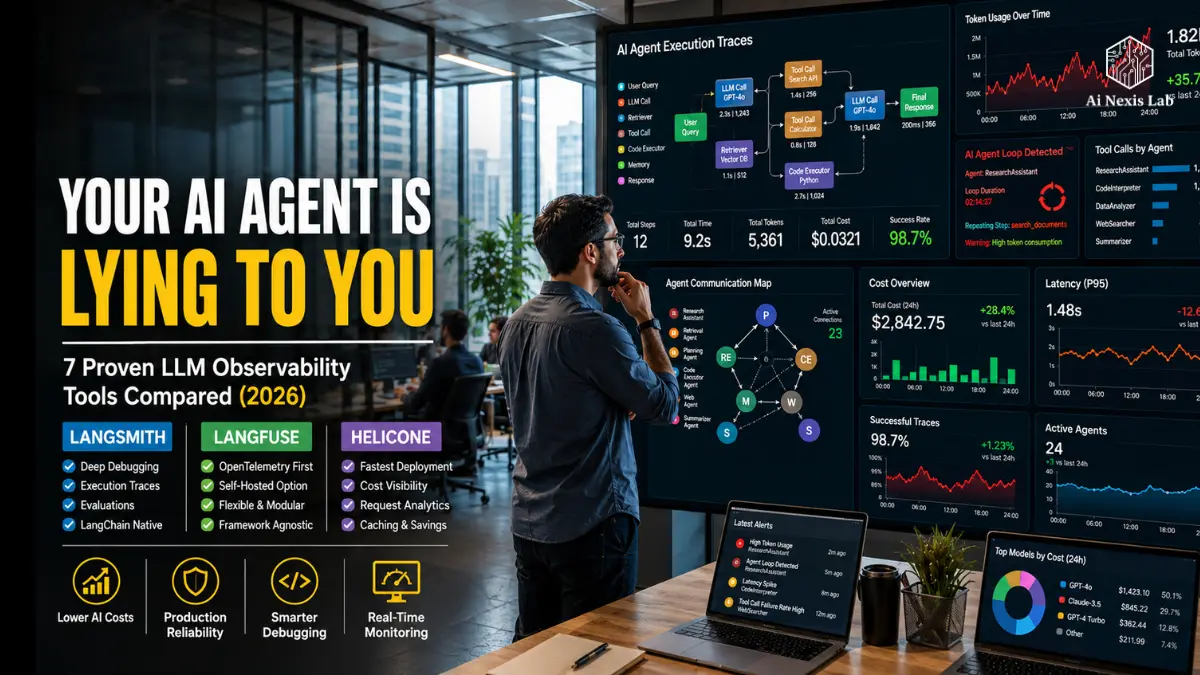
For the past few weeks, I’ve spent time comparing three platforms that come up in almost every serious conversation about production AI agents: Langsmith, Langfuse, and Helicon. Instead of judging them based on feature checklists or polished demos, I focused on how they behave in real production situations where agents loop unexpectedly, tools fail, prompt drift, and costs slowly spiral upward.
This distinction is more important than most marketing pages admit.
It’s easy to make any monitoring platform impressive when a demonstration agent books a restaurant reservation in three complete steps. The product rarely behaves this politely.
Real agents retry requests.
They deal with incomplete information.
They use multiple tools.
They recover from failures.
Sometimes they get stuck making surprisingly human mistakes – except those mistakes happen thousands of times a day and generate invoices instead of embarrassment.
The goal of this guide is not to crown a universal winner because there probably isn’t one.
Instead, we are going to build a practical mental model to understand what observability really means in an AI-native application. Then we will compare today’s leading platforms through that lens, not through marketing claims.
By the end, you will be able to answer three questions with confidence:
- What information should each production AI agent obtain?
- Which observability platform best fits your architecture rather than another?
- How can you spot costly failures before customers – or your finance team – discover them first?
Those answers become increasingly important as AI agents move from internal experiments to systems that directly impact revenue, customer experience, and operating costs.
Because once an autonomous agent starts making thousands of decisions every hour, “it seems to be working” is no longer really a monitoring strategy.
Table of Contents
What “Observability” Really Means When Your Application Talks to Itself
Traditional software has one big advantage: it’s predictable.
If you write a function that adds two numbers together, it will keep adding those numbers together tomorrow, next month, and next year. The same input produces the same output every time unless the code changes.
AI agents don’t play by those rules.
Give the same model the same prompt twice and you will often get slightly different reasoning paths. Sometimes the final answer is almost the same. Other times, the agent chooses a completely different tool, explores another branch of reasoning, or burns through significantly more tokens before reaching the same conclusion.
That’s not necessarily a flaw – it’s just how modern language models work.
The problem is that this uncertainty changes what engineers need to monitor.
In a traditional web application, distributed traces typically answer straightforward questions:
- Which services handled the request?
- How long did each service take?
- Where did the request fail?
- What database query slowed everything down?
Those are still valuable questions, but they are no longer enough when an AI agent starts making its own decisions.
Now you need visibility even into questions that never existed before.
Why did the agent choose this tool instead of another?
What information did the model see immediately before making that decision?
How many retries were there behind the scenes?
Did the retries actually improve the answer, or just increase the cost?
Which prompt version was running when the quality suddenly dropped?
Without those answers, debugging becomes little more than educated guesswork.
Imagine a travel-planning agent suddenly starting to recommend hotels hundreds of miles away from a customer’s destination.
A traditional monitoring platform might tell you that the request succeeded in 3.1 seconds.
Great.
But it doesn’t explain whether the retrieval system returned bad documents, whether the model misread the location, whether the mapping tool produced incorrect coordinates, or whether the agent simply ignored good context.
The application worked.
The result didn’t come.
That’s a very different kind of failure.
This is where it is helpful to separate three concepts that are often used interchangeably, even though they solve very different problems.
Logging Records Events
Logs tell you when something happened.
A prompt was sent.
A resource was called.
An exception occurred.
Those records are incredibly useful, but they are mostly historical. They capture individual events without explaining how those events connect to a larger story.
Monitoring Watches For Known Issues
Monitoring is a level above logging.
It constantly monitors metrics you already care about – latency, uptime, error rate, token usage, or infrastructure health – and alerts you when something crosses a predetermined threshold.
It’s great for finding problems you might have already anticipated.
If API latency exceeds five seconds, send a Slack alert.
If the error rate increases by more than two percent, page the on-call engineer.
Monitoring answers questions you already knew to ask.
Observability Helps You Answer Questions You Never Expected
Observability is different because it assumes that the next failure will not look like the last one.
“Did the latency exceed five seconds?” Instead of asking, you may need to suddenly ask:
Show every conversation where the refund tool was called more than twice after a successful payment lookup.
Or:
Find all traces where GPT-5 chose Tool A, even though Tool B historically produced better results.
This is not the metric most teams think about creating ahead of time.
Observability works because the underlying telemetry is so rich that you can investigate entirely new questions after an event has occurred – not before.
This is especially important for AI systems because their failure modes change over time.
Prompt updates introduce a subtle regression.
The model provider changes the default behavior.
The retrieval index gradually decreases as new documents are added.
Third-party tools start to time out under heavy traffic.
None of those issues trigger obvious application errors, yet each of them can quietly reduce quality or increase operating costs.
That’s why many teams discover problems weeks after deployment, not hours.
Their applications never stop working.
Their agents simply stopped working efficiently.
TRACE Stack™: A Practical Blueprint for Product AI Observability
Before comparing observability platforms, it’s worth stepping back and asking a simple question:
What should you actually measure?
Many teams choose a dashboard or a tool because another company uses it. That’s a given.
The platform is much less important than the information you are collecting.
Over time, I have found it useful to think of AI observability as five core capabilities. Together, they form what I call the TRACE Stack™ – a practical checklist that applies regardless of which framework or monitoring platform you choose.
T – Telemetry at the span level
Every meaningful action deserves its own span.
It also includes model calls, recovery steps, tool execution, API requests, database lookups, and sub-agents that work independently.
Why?
Because once an agent performs more than one action, a single request log loses almost all diagnostic value.
Imagine trying to understand why a relay race failed, when you know the team’s finishing time. You won’t know which runner stumbled.
Span-level telemetry lets you replay the entire sequence instead of keeping track of a single number.
R – Routing and Tool Visibility
One of the biggest blind spots in production AI systems is tool selection.
It is not enough to know that the tool executed successfully.
You also need to know:
- Why was this tool chosen?
- What arguments were passed?
- How long did it take?
- What data was returned?
- Did another tool fail first?
There are many more costly bugs hidden in these routing decisions than within the language model.
A – Anomaly and Drift Detection
Individual failures are rarely the real problem.
Patterns are.
One unusually expensive conversation is not necessarily the problem.
Five hundred almost identical conversations certainly do, burning three times the expected token budget.
A good observability platform helps to automatically identify those trends, rather than expecting engineers to manually sift through thousands of traces to find subtle changes.
C – Cost Attribution
Most organizations know their monthly AI bill.
Very few understand where that money actually went.
That is a problem.
You will be able to answer questions such as:
- Which feature generated the most cost?
- Which customer workflows use the most tokens?
- Which prompt update increased costs?
- Which agents are looping unnecessarily?
Without attribution, cost optimization becomes a guesswork task.
With attribution, it becomes an engineering problem that you can actually solve.
E – Continuous Evaluation
Observability should not end when product traffic ends.
The best teams feed the product trace back into automated evaluation.
It creates a feedback loop where yesterday’s failures become tomorrow’s regression tests.
Instead of waiting for another customer to report the same issue, your evaluation pipeline catches new code before it reaches production.
It’s one of those investments that initially seems optional but becomes essential once agents take on business-critical tasks.
The important thing to remember is:
No observability platform is equally good at every part of the TRACE Stack™.
Some prioritize deep debugging. Others focus on open standards, infrastructure flexibility, or cost analysis. Understanding these five pillars first makes it much easier to evaluate each platform based on your own architecture rather than marketing claims.
With that framework, we can finally see the three platforms that most engineering teams are considering today – and where each really shines, where each falls short, and what types of production environments they fit best into.
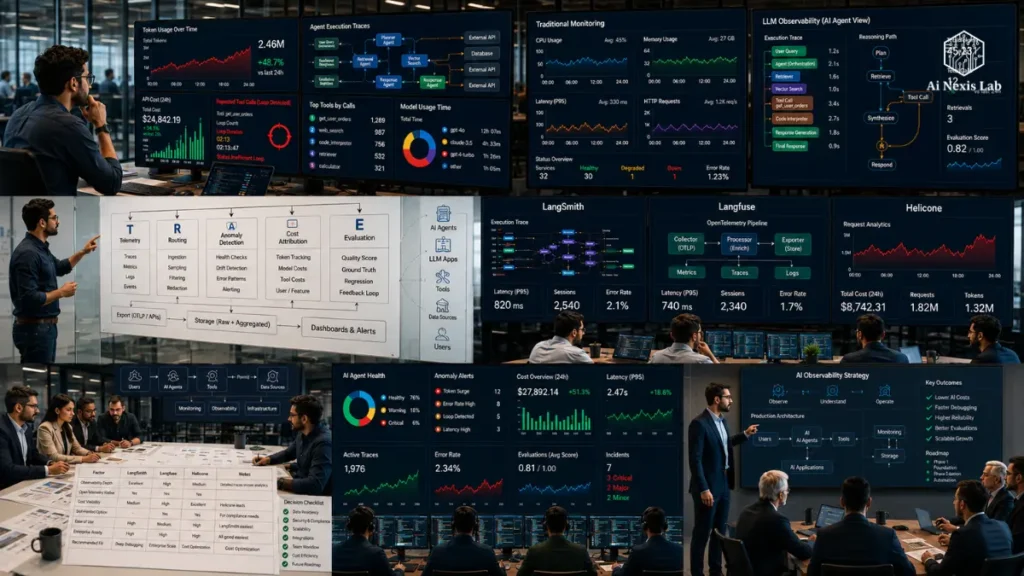
LangSmith: The Best Choice If You’re All-In on the LangChain Ecosystem
If your team is already committed to Langchain or Langgraph, there’s a good chance you’ve looked at Langsmith. And honestly, that’s where he makes the strongest case for himself.
Unlike many observability platforms that seem to bolt on to the application after the fact, Langsmith feels like it was designed with its supporting framework in mind. That tight integration becomes apparent when you are first debugging a production problem.
Instead of digging through scattered logs and trying to recreate what happened, you can replay the entire agent execution as if watching a recording. Every node, every state transition, every tool call, every prompt, and every model response appears as part of a continuous timeline.
That alone can save hours during incident investigation.
Imagine an agent responsible for processing customer refunds.
A customer reports that a refund was not issued even though the conversation ended successfully. Traditional monitoring tells you that the API returned a 200 response. That’s nice – but it doesn’t explain why the refund never happened.
Within Langsmith, you can literally follow the agent’s decision path.
Maybe they checked the order.
Then the payment was verified.
Then they tried to call the refund tool.
The tool rejected the request due to incorrect parameters.
The agent misunderstood the error message, chose another logical path, and politely apologized to the customer instead of properly trying again.
Without trajectory replay, it would be nearly impossible to quickly recreate that entire sequence.
For teams running complex language workflows, this level of visibility is incredibly valuable.
Where Langsmith Really Stands Out
The biggest advantage isn’t the dashboard.
It’s the context.
Each execution preserves the relationships between prompts, model outputs, tools, intermediate reasoning steps, and state changes. Instead of looking at separate logs, you are seeing the full story behind the decision.
It makes debugging feel less like detective work.
Langsmith also performs well when it comes to evaluation, which is an area that many teams underestimate.
The product is not just about keeping agents online. It’s about making sure they continue to produce good answers as the prompts evolve and the models change beneath you.
Langsmith includes several built-in evaluation approaches, including rule-based scoring, automated comparisons, and LLM-driven judges. Human reviewers can annotate traces directly, creating datasets that become increasingly valuable as your application matures.
Over time, those evaluations become regression tests for your AI system.
Instead of wondering if yesterday’s prompt update accidentally reduced answer quality, you can measure it.
It’s a healthier way to send changes than relying on intuition.
Where Langsmith starts to show its limitations
No platform is perfect, and Langsmith is no exception.
Its greatest strength – being deeply integrated with Langchen – also creates its greatest limitation.
Many engineering teams don’t stay in the same structure forever.
It is becoming increasingly common to see applications that mix LangGraph with direct OpenAI SDK calls, internal orchestration layers, MCP servers, or newer frameworks like PydanticAI and Vercel AI SDKs.
This is where things become less seamless.
Although LangSmith supports importing external telemetry via OpenTelemetry, those traces are ultimately translated into LangSmith’s own execution model.
That translation works.
It doesn’t always work perfectly.
Some framework-specific details get lost along the way, giving engineers less credibility than the picture they get from the original integration.
Another consideration is portability.
Once months of product trace accumulate in a proprietary system, it becomes significantly more difficult to migrate elsewhere.
Most teams don’t think about vendor lock-in during the evaluation phase.
They usually start thinking about it after collecting six months of historical production data.
By then, switching platforms is no longer a small project.
Pricing is also worth considering.
Langsmith generally follows a seat-based model, which works well for small engineering teams. However, as organizations grow, costs increase, with the number of developers who need access – not necessarily with actual agent traffic.
Depending on how your company grows, it can be completely reasonable or surprisingly expensive.
The important thing is not whether Langsmith is expensive or prohibitive.
It is that it is optimized for a specific ecosystem.
If you’re already committed to that ecosystem, the trade-off often makes perfect sense.
Langfuse: Built for Teams That Don’t Want to Be Locked Into One Stack
Langfuse approaches observability from almost the opposite direction.
Rather than forcing developers to accept a specific framework, it starts with the assumption that most modern AI systems are messy.
And honestly, they’re right.
Very few production applications today have a single framework that makes neat, predictable calls.
A typical enterprise AI workflow might include OpenAI for generation, Anthropic for reasoning, a vector database for retrieval, internal APIs, custom Python services, MCP servers, several external tools, and perhaps another model that evaluates everything later.
Trying to squeeze it all into one framework-specific representation is not always realistic.
That’s where Langfuse gets a lot of respect.
Instead of reinventing observability, Langfuse embraces OpenTelemetry (OTel), which is the same standard that many engineering organizations already use in distributed systems.
At first glance, it seems like an implementation detail.
It really isn’t.
Why OpenTelemetry Is Changing The Conversation
Many companies already run mature observability stacks.
They are using Grafana’s dashboard.
They are collecting traces through Jaeger.
They are monitoring the infrastructure with DataDog.
Their engineers already understand those tools.
Langfuse isn’t asking those teams to create a completely different monitoring world just because AI has entered the architecture.
Instead, AI Trace becomes another part of the existing system.
It may seem small unless you are the person responsible for maintaining the product.
A dashboard.
A tracing standard.
A warning pipeline.
Low operational overhead.
Framework-Agnostic by Design
Another reason why Langfuse has become increasingly popular is flexibility.
Whether you are using Langchain, PydenticAI, Vercell AI SDK, raw OpenAI API, Anthropic, or a completely custom orchestration layer, Langfuse treats every component as part of the same trace.
That flexibility becomes increasingly valuable as AI infrastructure evolves.
The AI ecosystem changes incredibly quickly.
Frameworks that dominate a year can lose momentum surprisingly quickly.
Choosing framework-agnostic observability reduces the chance that your monitoring strategy will become obsolete whenever your engineering team adopts a better orchestration library.
Self-Hosting Isn’t Always Free
One feature people consistently mention is self-hosting.
Yes, LangFuse is open source.
Yes, you can deploy it yourself.
Yes, it is important for organizations dealing with healthcare records, financial information, government contracts, or strict European data residency requirements.
But it’s worth being realistic about what “self-hosted” really means.
Running a production observability infrastructure is not like spinning up a Docker container on the weekend.
Someone has to maintain the database.
Someone has to handle the storage growth.
Someone has to oversee backups, upgrades, scaling, and performance tuning.
If your company already has a platform engineering team, it can usually be managed.
If you’re a five-person startup, those responsibilities can quietly consume time that would be better spent improving the product.
That’s why self-hosting is not automatically a cheap option.
Sometimes paying for managed infrastructure costs less than paying engineers to maintain it yourself.
Where Langfuse Excels
Langfuse shines when flexibility is more important than convenience.
Its hierarchical tracing model captures the full implementation path across multiple services, providers, and frameworks without forcing developers into a single ecosystem.
Cost tracking, token usage, latency, recovery performance, and custom metadata all become part of a single trace that remains portable because it is built on open standards.
Its valuation features are improving every year, although they still don’t match the maturity of Langsmith’s integrated valuation workflow.
For many teams, though, that’s an acceptable trade-off.
They would rather own their data, integrate with existing infrastructure, and avoid long-term vendor lock-in than gain a few extra debugging conveniences.
Neither philosophies are inherently better.
They are solving various organizational problems.
And that’s why choosing an observability platform starts with understanding your architecture – not someone else’s feature comparison chart.
Helicon: The Fastest Way to See What’s Happening – But Not the Whole Story
While Langsmith is designed around the Langchain ecosystem and Langfuse is built around open observability standards, Helicon takes a completely different approach.
Its philosophy is refreshingly simple:
Don’t ask developers to instrument every part of their application.
Instead, sit between the application and the model provider.
In practice, this means replacing your normal API endpoint with Helicon’s proxy endpoint and adding an authentication header. It is often enough to start collecting request data immediately.
For small teams, it’s incredibly attractive.
You don’t need to refactor the agent logic.
You don’t need to wrap every tool call.
You don’t have to spend days wiring the SDK into existing code.
In a few minutes, you can start answering practical questions like:
- Which model is costing us the most?
- How many requests are we sending every hour?
- Which users generate the most token usage?
- Are our prompts becoming more expensive over time?
For startups trying to move quickly, those answers are often more valuable than a deep implementation trace – at least initially.
Sometimes the quickest solution is actually the right one.
Excellent For Cost Visibility
One area where Helicon consistently performs well is financial monitoring.
Many teams underestimate how quickly AI costs can escalate once the application gains real users.
A feature that looks cheap during internal testing can become surprisingly expensive after thousands of conversations every day.
Helicon’s dashboards make it easy to spot those trends.
Instead of just looking at monthly invoices, engineering teams can study usage by model, endpoint, customer, or application.
That makes optimization much easier.
For example, imagine that an internal workflow is responsible for almost half of your monthly AI costs.
Maybe the prompts are too long.
Perhaps unnecessary retries occur after a timeout.
Perhaps the retrieval pipeline keeps sending duplicate references to the model.
Without clear cost attribution, those issues remain hidden.
With proper analysis, it can usually be improved.
Another useful capability is semantic caching.
If your application frequently receives nearly the same prompt, Helicon can provide cached responses instead of sending each request back to the model provider.
For specific customer support, documentation, or internal support workloads, that can significantly reduce both latency and operating costs.
Not every application benefits equally, but when caching fits the workload, the savings can be meaningful.
Where The Architecture Starts To Show Limitations
The same design that makes Helicon easy to deploy also limits what it can observe.
The proxy only sees the requests that pass through it.
He naturally cannot understand the internal reasoning process that occurs within an autonomous agent.
Consider an agent that:
- Retrieves documents,
- Evaluates trust,
- Calls three external tools,
- Delegates the task to another agent,
- Retries the failed action,
- Then produces a final response.
From the outside, Helicon mostly observes individual model requests.
It naturally doesn’t understand that all those requests are part of a larger decision-making process.
In other words, it captures requests better than it captures reasoning.
This distinction becomes increasingly important as agents become more sophisticated.
Simple assistants that answer one question per interaction fit comfortably into Helicon’s architecture.
Complex multi-agent systems often do not.
Teams usually discover this limitation during debugging.
Everything seems normal until the agent starts looping unexpectedly or repeatedly calling the wrong tool.
At that point, request-level analytics only tell part of the story.
Engineers still need to reconstruct why those requests occurred in the first place.
Platforms built around span-level tracing usually make that investigation much easier.
The Acquisition Question
Another factor to consider is the long-term platform direction.
In early 2026, Helicon became part of Mintlify.
The platform continues to receive updates, and existing functionality remains available, so there is no immediate cause for concern.
However, acquisition inherently introduces uncertainty.
Roadmaps change.
Priorities shift.
Products are more tightly integrated with the parent company’s ecosystem.
None of those outcomes are necessarily negative, but infrastructure decisions typically last much longer than application features.
If you are choosing an observability platform that you will rely on for years, it is worth paying attention to ownership changes – not because they are automatically bad, but because they are part of the broader risk calculation.
Comparing Three Platforms Without the Marketing Hype
After spending time with all three platforms, one thing became clear:
People often ask the wrong question.
Instead of asking,
“Which observability platform is best?”
They should probably ask,
“Which platform matches the way our engineering team actually builds software?”
Those are very different questions.
Each platform creates a different architectural trade-off.
Langsmith prioritizes the developer experience within the Langchain ecosystem.
If your production agents are already built around Langgraph, its debugging capabilities are really hard to beat. Trajectory replay, state visualization, integrated evaluation, and polished workflow create a very smooth experience.
The trade-off is ecosystem dependence.
The further your architecture extends beyond Langchen, the more significant those boundaries become.
Langfuse prioritizes openness and flexibility.
Rather than assuming that one framework will dominate forever, it embraces open standards that naturally fit into existing observability frameworks.
Organizations already invested in OpenTelemetry often find this approach much easier to scale over time.
The trade-off is complexity.
Greater flexibility usually requires more operational responsibility, especially for teams that choose to self-host.
Helicon focuses on simplicity.
Deployment is dramatically faster than most alternatives, and its cost analysis is excellent for organizations primarily interested in understanding AI costs.
The trade-off is depth.
Because the platform observes requests rather than the entire execution tree, debugging sophisticated autonomous agents becomes more challenging as workflows become more complex.
None of those trade-offs are inherently right or wrong.
They are a reflection of different design philosophies.
That’s why feature comparison tables can be misleading.
A startup shipping its first AI-powered feature doesn’t necessarily need enterprise-grade distributed tracing.
At the same time, a healthcare company running dozens of interconnected agents across a regulated infrastructure probably shouldn’t be optimizing for deployment speed alone.
Context matters.
More than feature lists.
More than pricing pages.
And certainly more than any other platform trending on social media this month.
A good question is always:
What problems are you trying to solve six months from now – not just this week?
Answer honestly, and the shortlist usually gets much smaller.
In the next section, we’ll move beyond product comparisons and look at a practical decision-making framework – the STACK-FIT Methodology™ – that helps engineering teams choose observability strategies based on architecture, compliance, scale, and long-term operational needs, rather than brand identity.
The STACK-FIT Method™: A Practical Way to Choose the Right Observability Platform
By now, you’ve probably noticed a pattern.
There is no clear “winner” between Langsmith, Langfuse and Helicon.
Each platform solves a different problem, and each asks you to accept a different set of trade-offs. That’s why making a choice based on a feature checklist – or worse, an attractive product demo – is usually a mistake.
A better approach is to first evaluate your own architecture.
Over the years, I have found it helpful to frame that decision around five questions. Together, they create what I call the STACK-FIT Method™.
It’s less about comparing products and more about understanding what your team will actually need six months after deployment, when the excitement of shipping wears off and real operational challenges start to appear.
S – Stack Alignment
The first question is surprisingly simple:
What does your technology stack actually look like today?
It’s not what you’re planning to make next year. It’s what’s currently running in production.
If your entire AI application revolves around LangChain and LangGraph, LangSmith naturally seems like the most polished experience. Its debugging tools deeply understand that framework because they were designed together.
But many teams don’t stay in the same ecosystem forever.
You can start with LangGraph, then introduce raw OpenAI API calls for one service, anthropic models for another, and finally add custom orchestration or Model Context Protocol (MCP) servers. Suddenly, your once uniform stack becomes a mix of different technologies.
That’s where framework-agnostic platforms often age more gracefully.
The important lesson here is not that one approach is better than another.
Changing observability platforms after collecting months of production data is more painful than choosing one that aligns with your long-term direction from the beginning.
T – Trace Complexity
Not every AI application requires enterprise-grade tracing.
A chatbot that answers FAQs can make a single model call before responding.
On the other hand, an Enterprise Research Assistant can:
- Search vector databases
- Ranked documents
- Call multiple external APIs
- Assign tasks to specific agents
- Run Python code
- Validate citations
- Generate final response
It’s not a request anymore.
It’s a complete workflow.
The more branching, retries, and tool calls your agents make, the more valuable true span-level tracing becomes.
This is where many teams accidentally underestimate the complexity of the future.
Today’s “simple assistant” has a tendency to become tomorrow’s multi-agent platform.
If this is likely to happen, it’s worth planning for that growth early rather than re-building your observability strategy later.
A – Audit and Compliance Requirements
For some organizations, compliance is just another item on the roadmap.
For others, it’s a roadmap.
Healthcare companies, financial institutions, government contractors, and organizations serving European customers often have strict requirements regarding data handling, retention, encryption, and residency.
Those requirements can eliminate certain options even before technical comparisons begin.
If your security team insists on self-hosted infrastructure, cloud-only solutions may never be approved.
If there is regulatory information in customer conversations, you will need to understand exactly where the traces are stored, who can access them, and how they are secured.
Ignoring these questions early usually leads to costly surprises during security reviews.
It is much easier to involve compliance teams before implementation than after production traffic starts flowing.
C – Cost Predictability
Most pricing pages seem cheap.
Production workloads have a way of changing that perspective.
When evaluating a viewability platform, don’t base your estimates on your current traffic.
Make an estimate based on the traffic you expect after a year.
Different pricing models measure differently.
Some developers charge per seat.
Others charge based on trace volume, observations, or stored telemetry.
Still others mainly track API requests.
None of those models are inherently unfair.
They are simply optimized for different types of organizations.
The important exercise is to run realistic estimates.
If your application grows tenfold, does observability remain a small operational cost – or does it quietly become one of your larger infrastructure costs?
You’ll want that answer before the finance team asks the same question.
K – Keep or Replace Existing Infrastructure
Finally, consider what you’ve already invested in.
Many engineering organizations have spent years building mature observability pipelines around tools like Grafana, Datadog, Prometheus, or OpenTelemetry.
Changing systems simply because AI has entered the picture often creates unnecessary operational complexity.
In that environment, integrating AI traces into existing dashboards usually makes more sense than creating an entirely separate monitoring ecosystem.
On the other hand, startups with less existing infrastructure can really benefit from an all-in-one platform that includes dashboards, assessments, tracing, and alerting without additional configuration.
Neither approach is universally correct.
The right answer depends on where your engineering organization is today – not where anyone else’s is.
One Piece of Advice That’s Worth Following
If you are evaluating multiple platforms, don’t rely on polished product demos.
Instead, choose the worst, most unpredictable AI workflow in your production environment and instrument it across each platform for a week.
The best observability tool is not the one with the prettiest interface.
It helps your team understand failures most quickly when something inevitably goes wrong.
Signal Protocol™: Turning Observability Into Action
Collecting traces is just the beginning.
One mistake I often see is teams spending weeks instrumenting their AI systems, celebrating beautiful dashboards, and then never looking at them again until an incident occurs.
That is not observability.
That’s digital archaeology.
The real value is in creating an alert strategy that identifies unusual behavior before customers notice something is wrong.
I prefer to think about that process through another simple framework: the Signal Protocol™.
S – Set Baselines Before Setting Alerts
You can’t identify abnormal behavior until you understand what “normal” really looks like.
Instead of creating alerts on the first day, let your system collect production data for two weeks.
Measure typical values for the following:
- Average token usage
- Cost per conversation
- Response latency
- Number of logic steps
- Tool call frequency
Those numbers become your baseline.
Without them, the warning threshold is little more than an educated guess.
I – Separate Metrics by Feature
An app-wide warning saying “AI costs have increased” doesn’t tell anyone where to look.
Instead, monitor individual agents, workflows, or production features separately.
Imagine your customer support agent suddenly starts averaging 35 tool calls per conversation while every other agent remains stagnant.
A feature-specific alert immediately narrows the investigation.
Global metrics often hide local problems.
G – Group of Similar Failures
Not every failed trace deserves immediate attention.
An unusual implementation path may simply reflect an edge case.
Hundreds of nearly identical failures appearing within an hour tell a very different story.
Modern observability platforms include clustering and grouping capabilities that automatically identify recurring patterns.
Those patterns are often more valuable than individual incidents because they reveal systemic problems rather than isolated errors.
N – Notify Based On Severity
Not every alert deserves the same response.
A slight increase in latency can probably wait until the next engineering stand-up.
An autonomous agent stuck in an expensive logic loop that burns hundreds of dollars every hour can instantly wake someone up.
Design your instruction strategy accordingly.
Otherwise, engineers get overwhelmed with low-priority alerts and eventually start ignoring everything – including what’s really important.
A – Annotate Every Incident
Every production incident teaches something.
Capture it.
When engineers investigate problematic traces, record the cause, resolution, and any lessons learned.
Over time, those criticisms become incredibly valuable.
Many organizations unknowingly solve the same problem multiple times because the previous investigation was never documented.
Good observability is not just about collecting telemetry.
It’s about preserving organizational knowledge.
L – Loop The Product Back Into The Evaluation
Perhaps the most overlooked step is to turn product failures into automated regression tests.
Whenever a meaningful problem appears, ask yourself one question:
Could this have been caught earlier in the deployment?
If the answer is yes, add that scenario to your evaluation pipeline.
Over time, your production events become your strongest test dataset.
The problem you solve today becomes one less problem after the next release.
That’s when observability starts to pay long-term benefits.
You are no longer just reacting to events.
You are systematically preventing them from happening again.
Self-Hosted vs. Managed: The Decision Isn’t Just About Price
This is where many teams get stuck.
On paper, self-hosting often seems like an obvious money-saving option. Managed platforms have recurring subscription fees, while open-source software appears to be “free.”
In reality, the math is rarely that simple.
The real question is not, “Which option costs less?”
It’s “What are we really paying for?”
If your organization already has experienced platform engineers, an established Kubernetes infrastructure, reliable monitoring, automated backups, and someone who enjoys maintaining a production database, self-hosting can be an excellent long-term investment.
You gain full control over your telemetry, decide how data is stored, and avoid relying entirely on a third-party vendor’s roadmap.
It is particularly attractive for organizations handling sensitive customer information or operating under strict regulatory requirements.
But many startups don’t have that luxury.
The five-person engineering team already has a lot to do. Every hour spent maintaining observability infrastructure is an hour not spent improving the product that customers actually pay for.
That’s why “free” software sometimes becomes the most expensive option.
The infrastructure costs may not be high, but engineering time certainly costs.
As a general rule in 2026:
Small teams with moderate AI traffic typically benefit more from managed services because the operational simplicity outweighs the subscription cost.
Growing companies with mature DevOps capabilities often find self-hosting more attractive as trace volume increases and infrastructure expertise already exists internally.
Large enterprises rarely make this decision based on public pricing pages. Procurement agreements, security reviews, and enterprise agreements typically have a much greater influence than list prices.
The mistake is not choosing managed or self-hosted.
The mistake is assuming they are interchangeable.
They are not.
One optimizes for convenience.
The other optimizes for control.
Neither is universally good.
Compliance: The Requirement That Can Eliminate Your Options
If your application operates in healthcare, finance, insurance, government, or serves enterprise customers, compliance isn’t just another comparison point – it can be a deciding factor before evaluating any features.
Questions like these appear early in security reviews:
- Where is trace data stored?
- Can customer conversations leave a specific geographic region?
- How long is telemetry retained?
- Who has administrative access?
- How is sensitive information encrypted?
- Can audit logs be exported?
If your observability platform can’t clearly answer those questions, your implementation will never reach production.
In many organizations, compliance teams are not trying to slow down innovation.
They are trying to reduce organizational risk.
That difference is important.
Regulations surrounding AI systems continue to evolve, especially when organizations process large volumes of customer data.
Requirements around data residency, retention policies, auditability, and access control have become significantly more important than they were just a few years ago.
For companies operating in multiple regions, especially in Europe, data sovereignty is no longer a specific concern.
Customers expect transparency about where their information is processed and stored.
This is one reason why self-hosted deployments remain attractive despite the additional operational overhead.
Ultimately, compliance should not be seen as something to “deal with later.”
It should be part of platform evaluation from day one.
Doing so prevents painful migration after your AI system is already serving real users.
Final Verdict: Choose Architecture, Not Brand
After comparing these platforms in real-world scenarios, one conclusion emerges:
There is no universally “best” observability platform.
There are simply platforms that suit different engineering priorities.
If your organization has certified on Langgraph and values an excellent debugging experience with an integrated evaluation workflow, Langsmith is hard to beat.
Its developer experience is polished, its trajectory replay is excellent, and it reduces the friction of understanding complex agent behavior.
The trade-off is accepting tighter integration with the Langchain ecosystem.
If flexibility, portability, and open standards are more important than framework-specific features, LangFuse offers an attractive alternative.
Its OpenTelemetry Foundation, framework-agnostic design, and self-hosting capabilities make it particularly attractive to organizations planning for long-term architectural flexibility.
The trade-off is more operational responsibility, especially for teams managing their own infrastructure.
If your immediate priority is to understand AI spending, monitor usage, and gain visibility with minimal implementation effort, Helicon remains a strong choice.
Deployment is remarkably fast, and its financial analysis provides immediate value for many applications.
There is a trade-off of reducing visibility in complex logic paths compared to span-based observability platforms.
The common thread across all three platforms is this:
Observability is not about collecting more data. It’s about collecting the right data.
A dashboard full of charts does not automatically improve reliability.
Millions of log entries don’t explain why autonomous workflows suddenly became three times more expensive.
Useful observability gives engineers enough context to answer questions they didn’t know they needed to ask.
This is the difference between reacting to events and preventing them.
Before committing to any platform, spend time evaluating one of your most complex production agents – not your cleanest demo.
Tool it.
See how it behaves under real traffic.
Investigate a few failures.
See which platform helps your team understand those failures with minimal effort.
The answer you get there will almost always be more valuable than any product comparison table.
At the end of the day, the best observability platform is the one your engineers will actually use during an event that happens at two in the morning – not the one that looked the most impressive during a sales presentation.
Frequently Asked Questions
What is LLM observability and why is it different from traditional application monitoring?
Traditional monitoring focuses on infrastructure metrics such as uptime, latency, and error rates.
LLM observability goes much deeper by tracking prompts, model responses, tool calls, reasoning paths, token usage, and execution traces throughout the AI workflow.
Without that additional context, the application may appear healthy while quietly producing poor responses, wasting tokens, or repeatedly making inefficient decisions.
Which observability platform is best for AI agents in 2026?
There is no single best option for every organization.
Langsmith works exceptionally well for teams invested in Langchain and Langgraph.
Langfuse is often a better fit for organizations that want framework independence and OpenTelemetry compatibility.
Helicon excels when rapid deployment and cost visibility are more important than deep implementation tracing.
The right platform depends more on your architecture than feature comparison.
Can I use more than one observability platform?
Yes, and many organizations do exactly that.
For example, a team might use Helicon for request-level cost analysis while relying on Langfuse or Langsmith for detailed implementation tracing and debugging.
Observability is not necessarily all or nothing, especially in large AI systems where different tools solve different problems.
How much overhead does AI observability add?
When implemented properly, the runtime overhead is usually very small.
Most modern platforms collect telemetry asynchronously, which reduces the impact on user-facing latency.
In practice, the benefits of faster debugging, better cost visibility, and improved reliability usually outweigh the slight increase in processing or storage requirements.
Is self-hosting right for startups?
Typically not in the early stages.
Unless your team already has infrastructure expertise or strict compliance requirements, managed services often provide a better balance of simplicity and operational efficiency.
As your application scales, self-hosting can become financially attractive – but only if you already have the engineering resources to properly maintain it.